Analytics · 5 minute read
Email analytics beyond opens: a dashboard you can trust
Understand accepted messages, unique clicks, subscriber growth, and attribution. Build an email analytics review that explains what happened and what to do next.
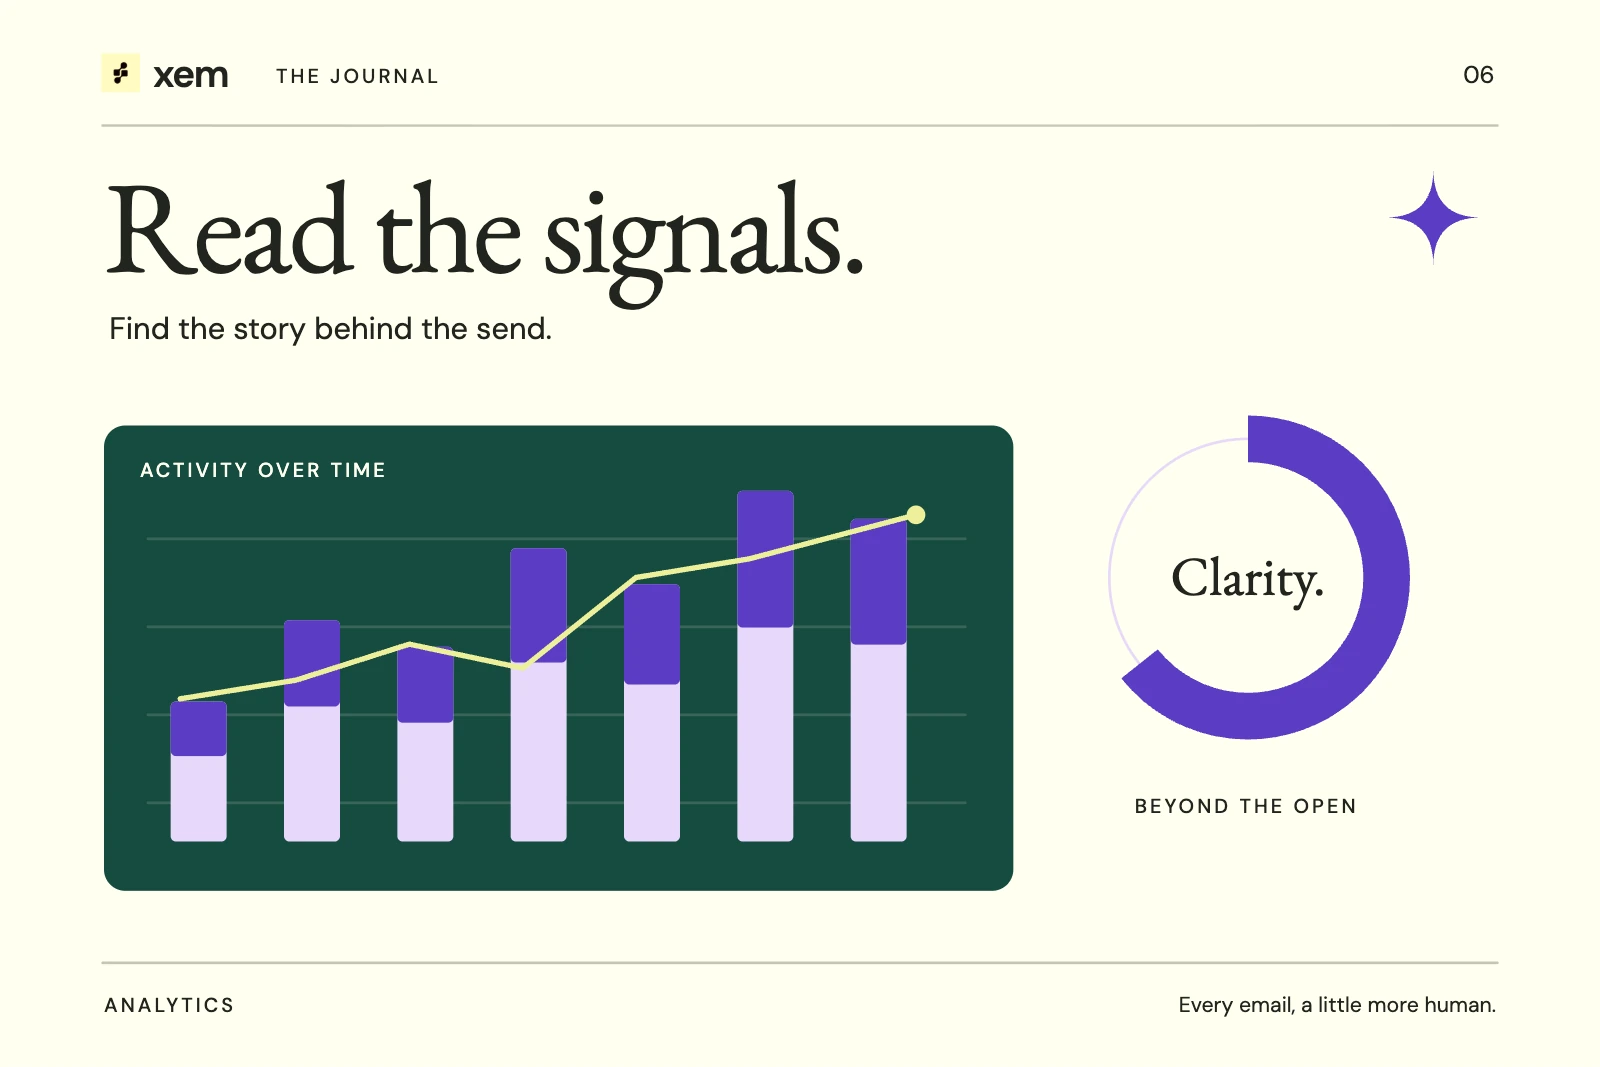
A dashboard becomes useful when two people can read a number and agree on what it counts.
“Clicks: 420” could mean click events, messages with at least one click, or distinct recipients who clicked. Those are three different measures. Putting them in a beautiful chart does not resolve the ambiguity.
Start by naming the unit. Then add a period, a denominator, and the limits of the observation. The result may be less dramatic than a wall of percentages, but it gives your team something reliable to discuss.
Separate sending, attention, and audience health
An email program has several jobs. It must submit mail successfully, earn a response, and maintain a healthy permission-based audience. No single rate describes all three.
| Question | Useful measure | Important limit |
|---|---|---|
| Did our sending system hand off the mail? | SMTP-accepted messages | Acceptance does not establish inbox placement. |
| How many people did we reach? | Distinct recipient addresses on accepted messages | Identity rules and campaign scope must be consistent. |
| Which messages prompted a click? | Messages with at least one observed click | Scanners can generate clicks. |
| Is the list growing? | Recorded changes in active subscriptions | Contact creation dates do not reconstruct subscription history. |
| Are we causing problems? | Known bounces, complaints, and opt-outs | Missing feedback is not evidence of zero complaints. |
Keep commercial outcomes in the conversation, but do not invent attribution. A click followed by a purchase is useful evidence only when you can explain how the records were connected and which attribution rules were applied.
Define click rates with an example
Suppose a campaign produces 1,000 accepted messages sent to 900 distinct addresses. Fifty messages receive at least one click, and those clicks come from 45 distinct addresses.
The message click rate is 50 ÷ 1,000, or 5%. The audience click rate is 45 ÷ 900, also 5% in this example. They happen to agree; they need not.
If one person receives four messages and clicks all four, that is four clicked messages but one person. If that person clicks ten times, the event count rises again without adding a message or a recipient.
These numbers are illustrative. The point is to choose the denominator that matches the question. For campaign content, a message-based view is often helpful. For audience coverage, distinct recipients may be more useful.
When there are no accepted messages, the rate is unavailable. Showing 0% suggests an observed failure to engage when there was no opportunity to engage at all.
Treat opens as a directional signal
Apple states that Mail Privacy Protection prevents senders from seeing whether a recipient opened a message and hides the recipient's IP address. Image loading can also be blocked, proxied, or automated in other environments.
That does not make all open data worthless. It does make precise claims about human attention difficult. Avoid automatically labeling someone “inactive” solely because an open was not recorded, or selecting a campaign winner only because a small open-rate difference appeared.
Clicks have their own limitations. Security scanners can follow links. Until a system has a tested classifier, label clicks as observed activity rather than verified human engagement.
Use two time views deliberately
A send-cohort report asks: what happened to messages sent during this period? An activity report asks: what happened during this period, including clicks on older messages?
Both are useful. They should not be mixed without explanation.
In Xem, the campaign volume bars follow accepted messages by send date. The activity view can include clicks on older mail. Device and time-of-day views describe recorded click events, including repeated clicks. Their totals therefore answer a different question from the unique-message rate cards.
Daily unique recipients also do not add up to period unique recipients. Someone reached on Monday and Tuesday appears in both daily counts but once in the period total.
Compare periods fairly
A campaign sent yesterday has had less time to accumulate clicks than one sent a month ago. Equal calendar ranges do not automatically create equal observation windows.
Use a consistent evaluation window when comparing individual sends: for example, the first several days after each campaign, chosen before evaluating it. Account for audience size and composition. A small, highly relevant segment may have a higher rate while producing fewer total responses.
Timezone matters too. A midnight boundary in UTC can divide a local evening campaign across two dates. Choose the reporting timezone deliberately and preserve it in exports and team discussions.
Read growth from history, not wishful reconstruction
A contact record can be imported today even if the person subscribed years ago. An address may belong to several lists. A record can exist while the person is unsubscribed or suppressed.
A trustworthy growth chart needs recorded subscription changes and a clear identity rule. If the system only began recording history recently, the earlier chart should be unavailable rather than backfilled from creation dates.
Xem distinguishes recorded active subscription history from current deliverability eligibility. That difference explains why a growth endpoint and an “active subscribers now” card may not describe precisely the same population.
End the review with one decision
A weekly analytics review should produce a specific next action: fix a broken destination, investigate a sending domain, revise a form promise, or test a clearer call to action.
Use campaign links with consistent UTM parameters if your web analytics setup supports them. Do not put email addresses or other personal data in those parameters.
Keep the definitions beside the charts. When everyone understands what a number means, disagreement can move to the interesting part: what the team should do about it.
Sources and further reading
Written with AI assistance and checked against the linked sources. Examples are illustrative. Our editorial approach